 Geosur
Type of resources
Available actions
Topics
INSPIRE themes
Keywords
Contact for the resource
Provided by
Years
Formats
Representation types
Update frequencies
status
Scale
-
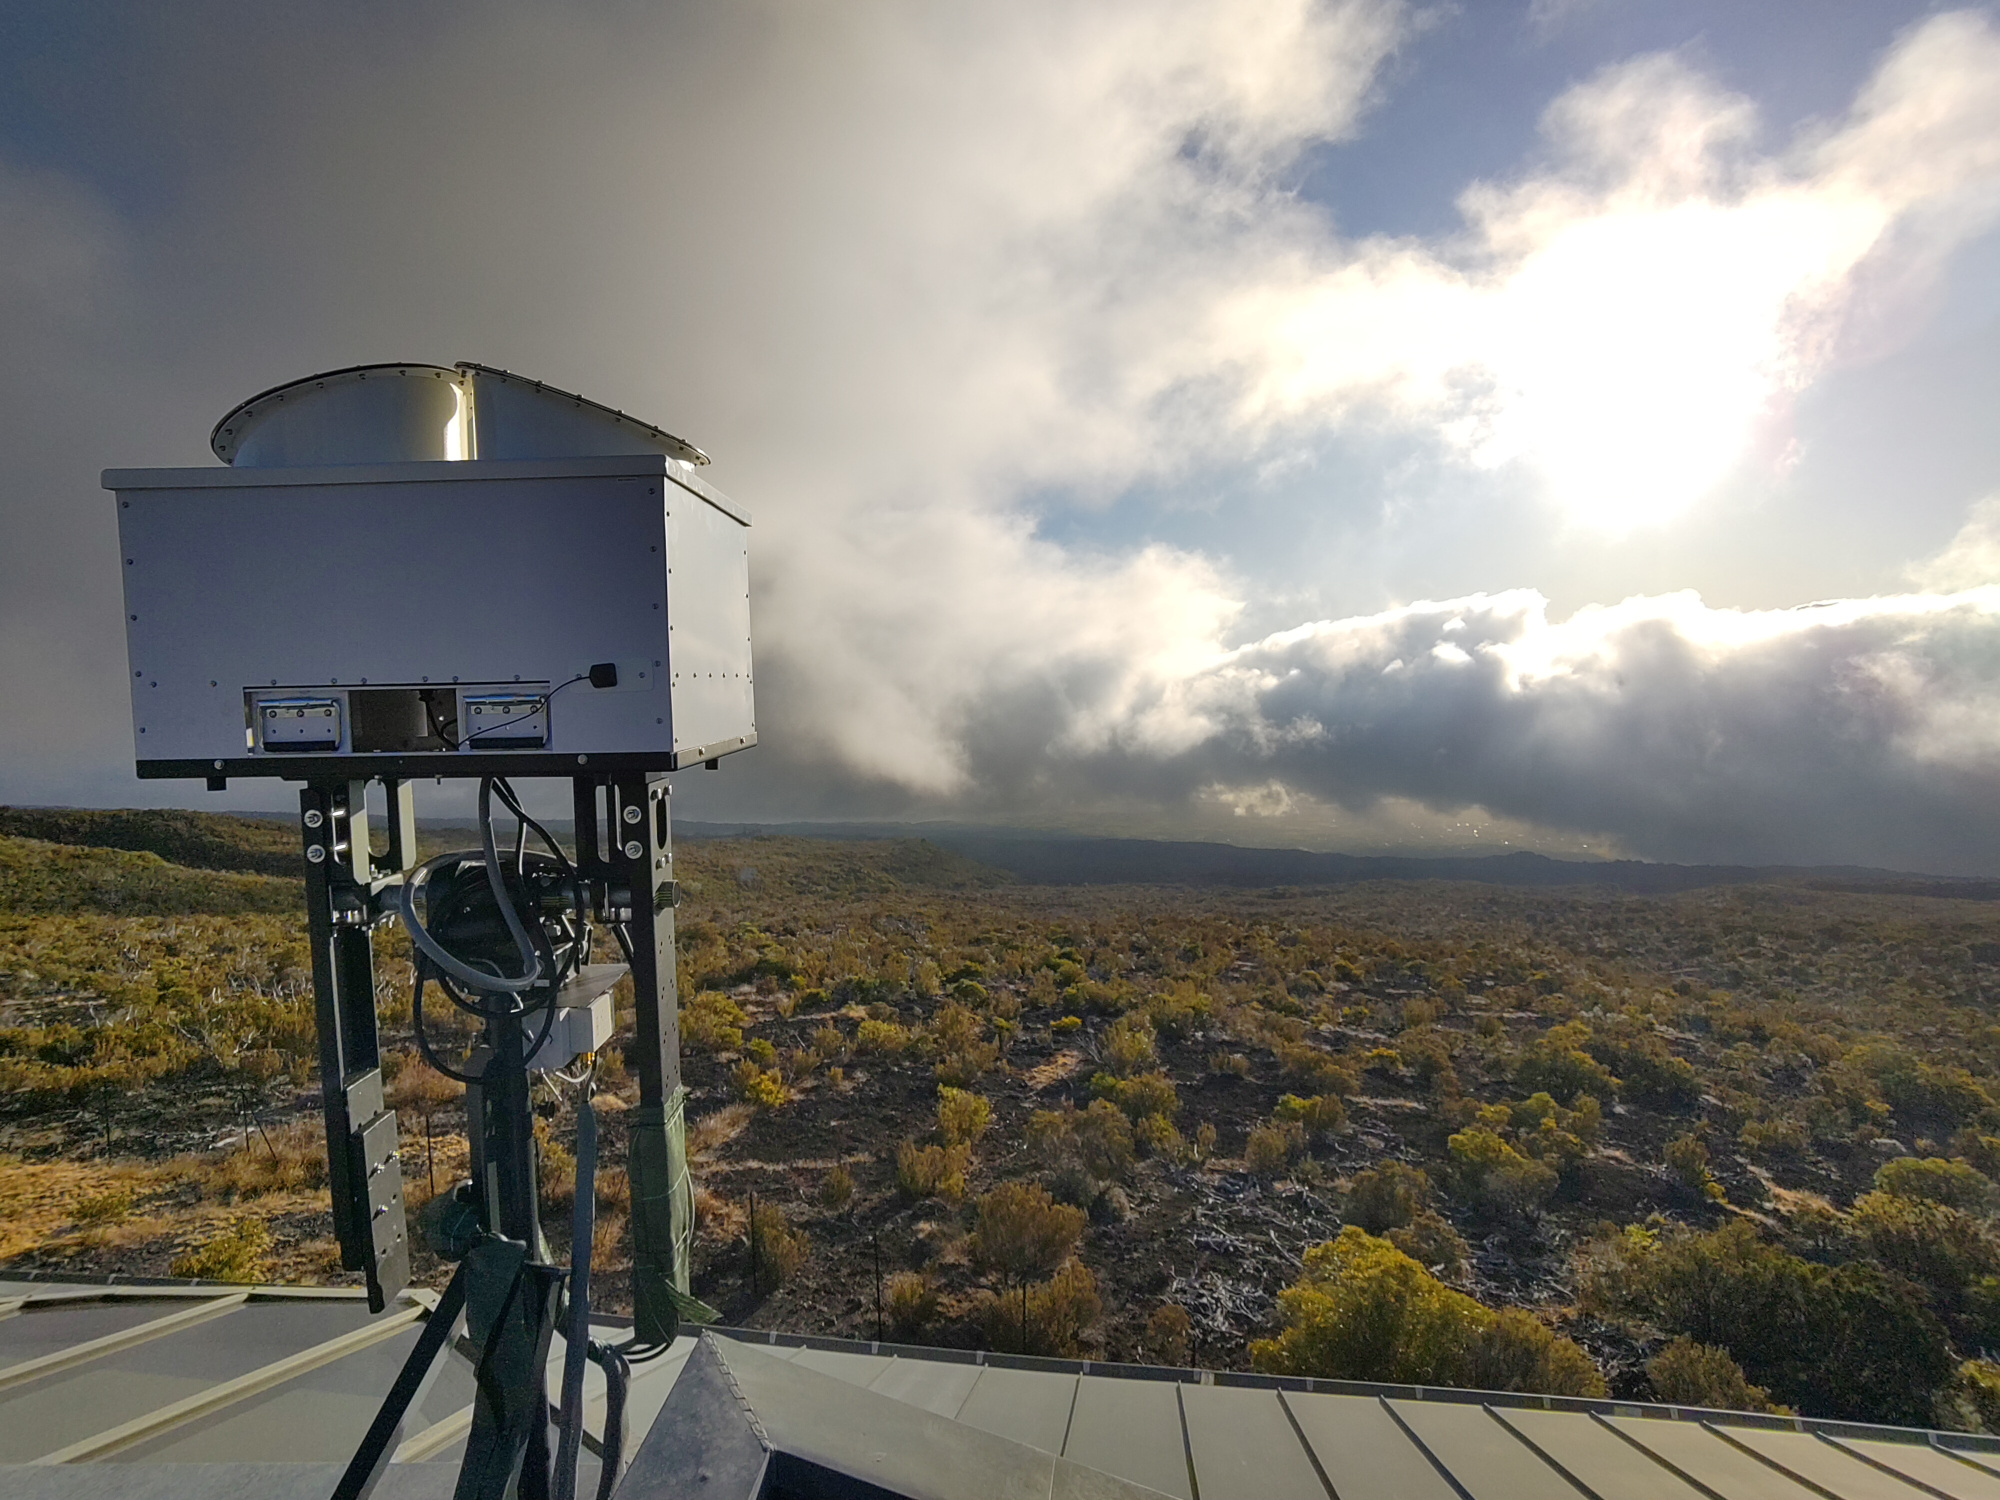
Honga Tonga Aerosols measurments from lidars at Maïdo observatory, Reunion Island (21.08°S, 55.38°E)
To do
-

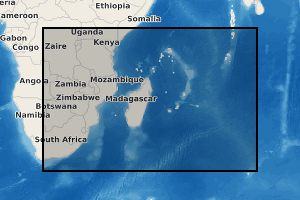
The overall objective of the ESPOIRS project is to obtain a better understanding of the variability, statistical properties and formation mechanisms of intense tropical precipitation at regional and local scales. ESPOIRS is thus interested in the entire life cycle of precipitation at several space-time scales. * Through the analysis of the distribution of the large-scale humidity field which drives the formation of precipitation at the regional scale using a GNSS network. * Through the characterization of internal (dynamics, microphysics) and external (interactions with the relief) processes, which drive the formation and life cycle of extreme weather events at the local scale => transportable Polarized Doppler X-band precipitation radar.
-
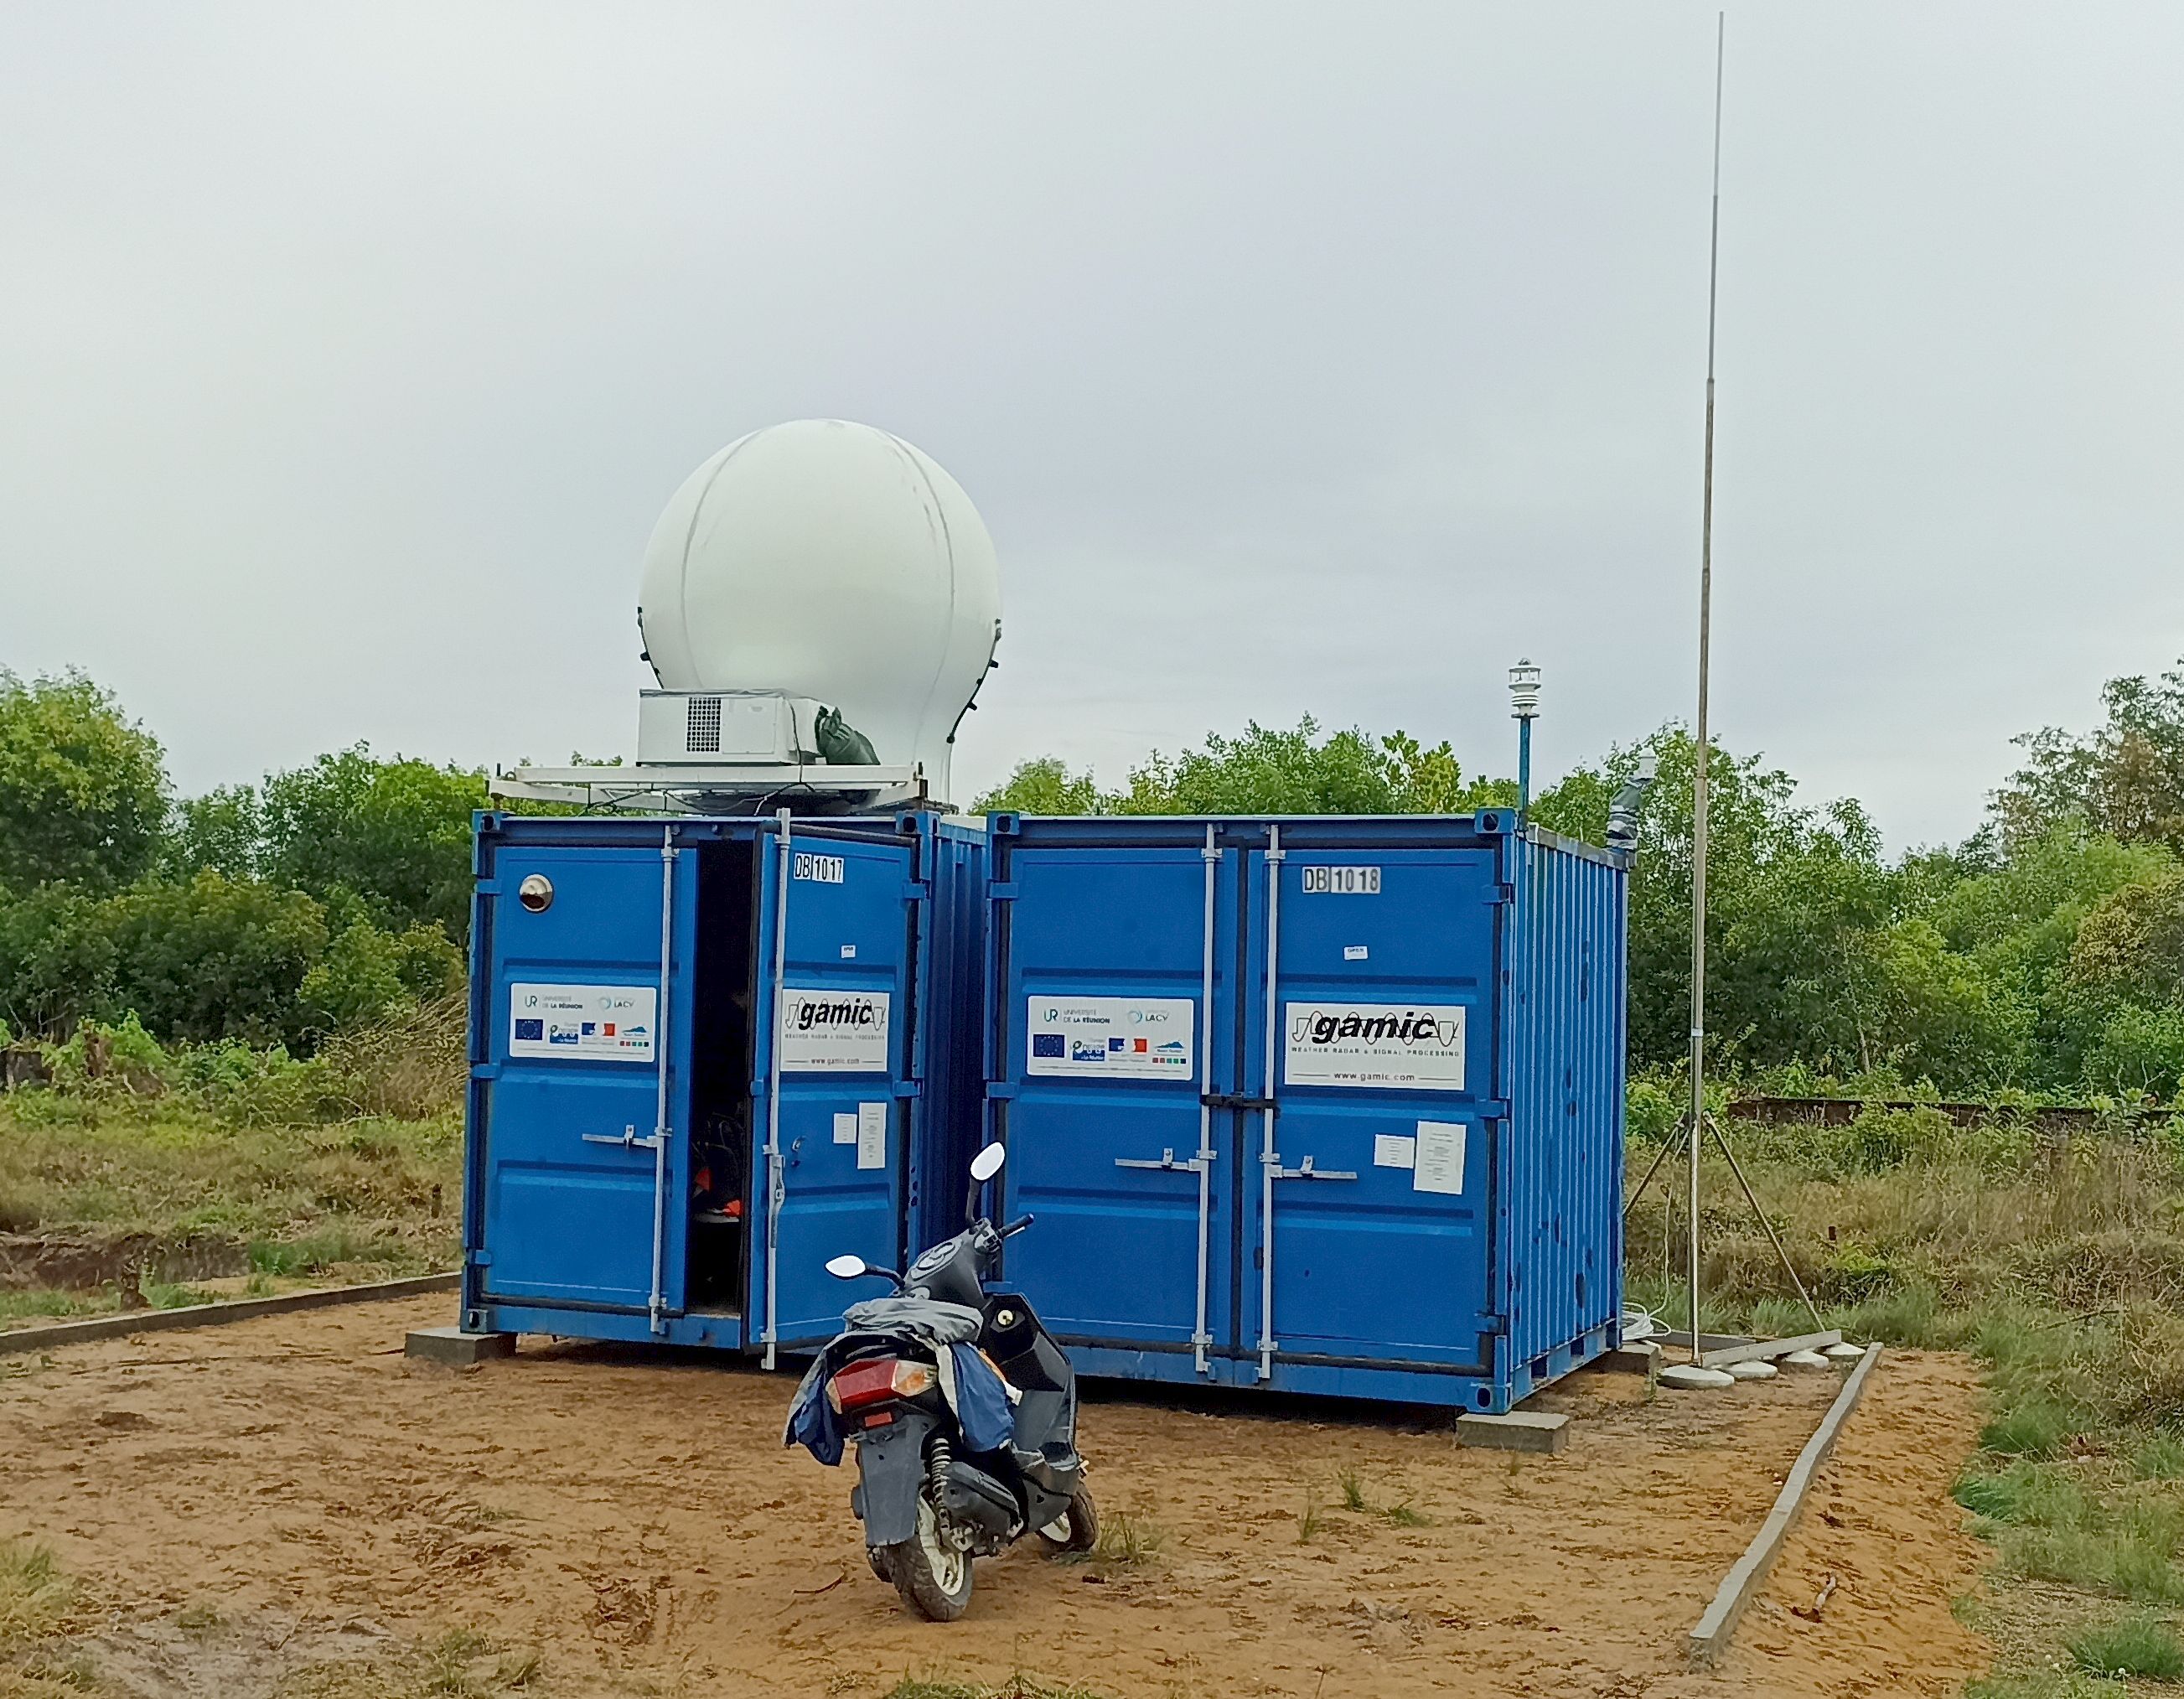
The ressource describes the dataset obtained by deploying the GAMIC GMWR-25-DP RADAR in Toamasina (Tamatave) in Madagascar.
-
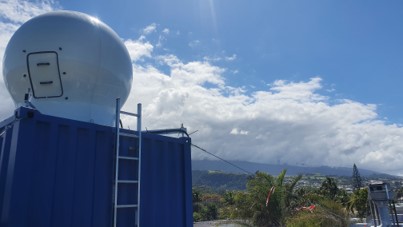
The ressource describes the dataset obtained by deploying the GAMIC GMWR-25-DP RADAR in the South of Reunion Island, in Saint Joseph.
-
Since 2012, 3 lidars from the Atmospheric Physics Observatory of La Réunion (OPAR) have been performing aerosol profile measurements at the Maïdo observatory site, located at 2160 meters to the west of the island of La Réunion. These profiles are obtained at several wavelengths, 355nm and 532nm, and there are also depolarized channels at 532nm. The data from these 3 lidars are processed in two stages: initially, the data are manually cleaned of disturbed profiles, either by atmospheric effects, such as the passage of clouds, or by electronic effects like noise. They are then summed over the night. This is the L1b level, and the data are available in the Matlab format (.mat). Subsequently, the data are processed to convert from a profile of received photon number to a profile of aerosol extinction and scattering. The methodology used is based on the Klett calculation at one wavelength. This is the L2b level, and the data are available in the NetCDF format (.nc) with the NDACC convention in the choice of variable names. Therefore, the data are distributed across 6 directories, 2 levels of processing for each lidar. The raw data from the instrument (called L0) are in a proprietary format, the Licel format, and are not accessible in open access, only via FTP with restricted access.
-
WW3 model reanalysis on SWIO (south-western indian ocean) area at 0.5 degree of resolution
-
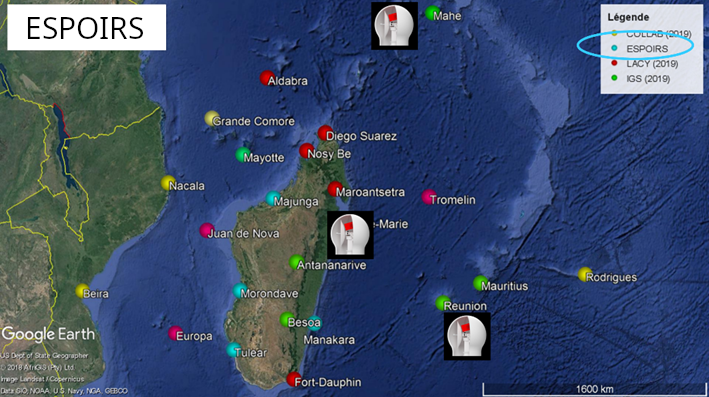
This ressource is part of the action 1 of the ESPOIRS Project. Multiple GNSS Stations have been installed or updated in the SWIO and the data are available here. "TO ADD : Different datasets, list of stations, etc ...."
-
Radiomètre micron-onde de haute précision pour la mesure de profils atmosphériques de vapeur d'eau et de température en continue
-
Le radar mini-BASTA est un radar nuage (95GHz) dédié à l’étude des nuages et du brouillard. Le radar mesure l’énergie rétrodiffusée par les hydrométéores, cette énergie peut donc être reliée à la quantité d’eau contenue dans le nuage (liquide et glace). Il fonctionne en routine quotidiennement sur le site de l’observatoire du Maïdo, sur l'Ile de La Réunion. Ce jeu de données est au niveau L0, et les données sont non calibrées. Paramètre principal: Profil vertical de réflectivité radar, mesure du décalage Doppler. Contexte de la mesure: observation routine.
-

The coastline or shoreline is the geographical boundary between sea and land. It corresponds according to the SHOM to "the leash of the highest seas in the context of an astronomical tide of coefficient 120 and under normal weather conditions (without overcost phenomenon). The coastline as defined above is not directly identifiable continuously on the ground or on a satellite or aerial image. From a perspective of studying the displacement of the shoreline, indicators allow us to approach this notion (the vegetation limit associated with the infrastructure limit, the beach limit, etc.). On the reef shoreline of Reunion Island the limit of vegetation and infrastructure as well as beach limit were retained. This limit results in the production of a line-type vector geographic information layer in a GIS resulting from the photo-interpolation on Pléiades satellite images. Pleiades satellite images from the Kalideos Réunion database (CNES) have been used since 2016 to study the position of the shoreline annually. Launched in 2011, Pléiades is a very high spatial resolution spatial image system (panchromatic optical instrument at 70 cm and 2.8 m multispectral) operating in the visible and near infrared with a swath of 20 km UMR Espace-Dev